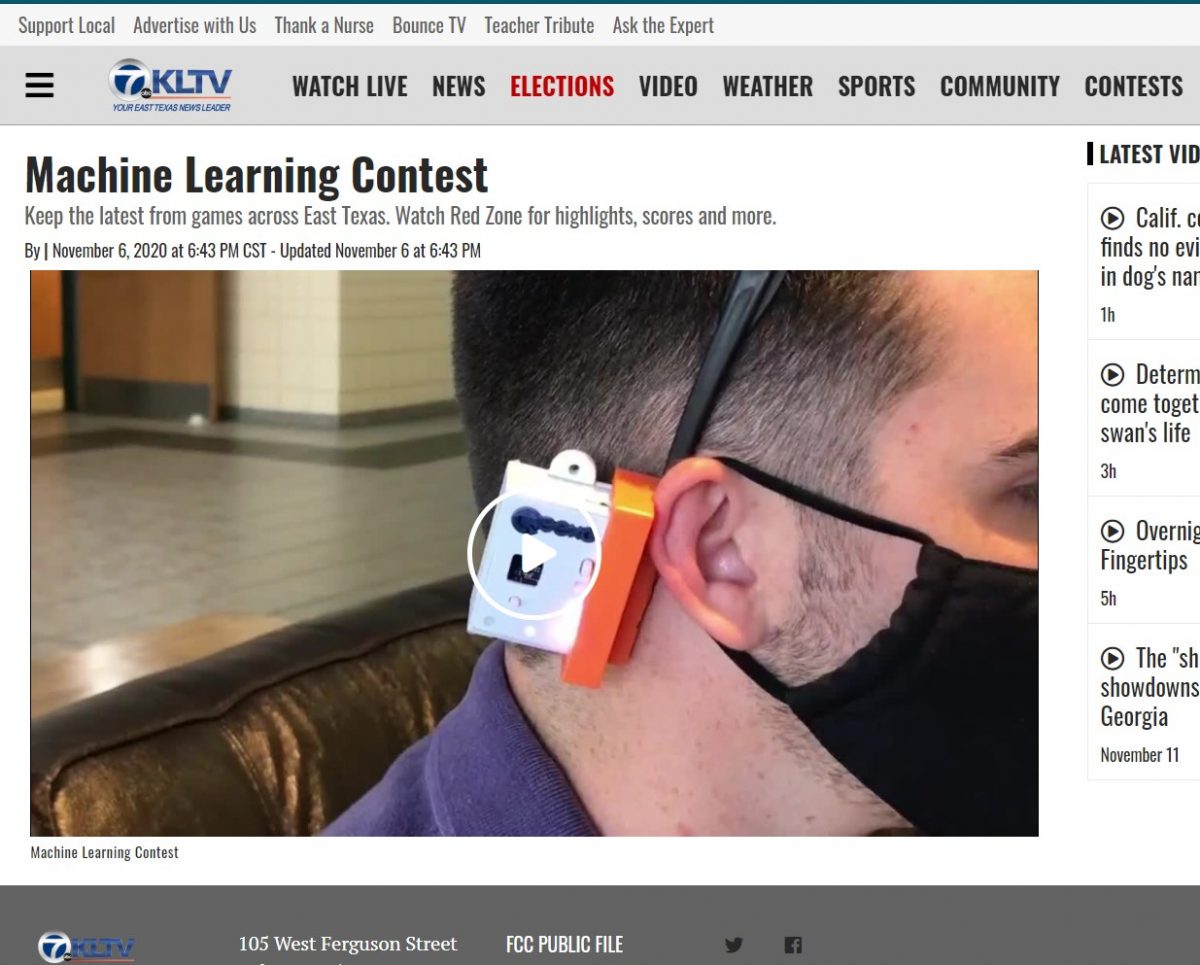
Click HERE to view the video
Full URL to video source: https://www.kltv.com/video/2020/11/06/machine-learning-contest/
Click HERE to view the video
Full URL to video source: https://www.kltv.com/video/2020/11/06/machine-learning-contest/

So-called smart devices like Amazon Echo and Google Nest made early headway into our homes. But will devices as small as a vibration sensor soon outsmart an Echo? Here’s a look under the hood of “TinyML.”
Read the full article at: https://diginomica.com/can-piece-drywall-be-smart-bringing-machine-learning-everyday-objects-tinyml

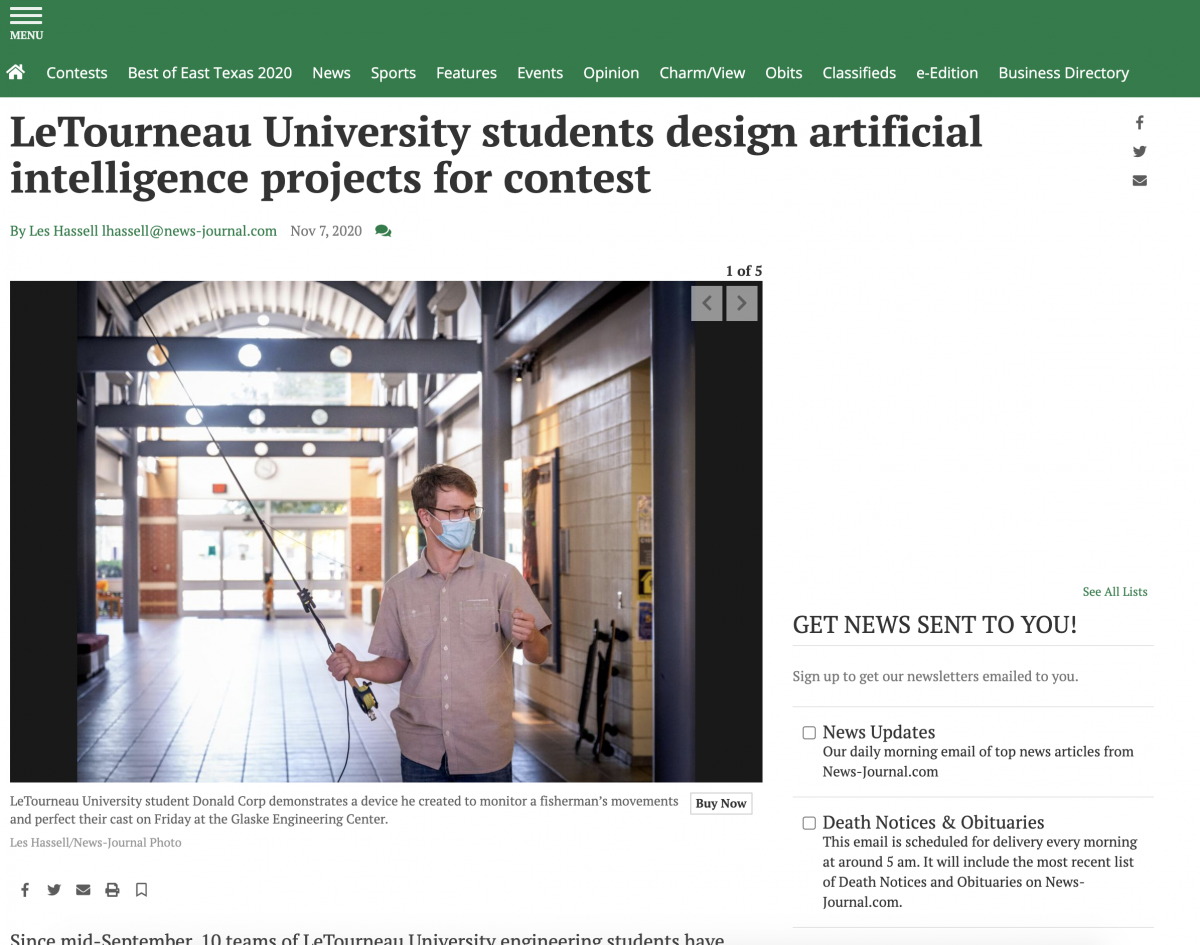
Since mid-September, 10 teams of LeTourneau University engineering students have been working on projects involving artificial intelligence to enter into a contest. Winners of that contest were announced Friday in the lobby of the Glaske Engineering Center after demonstrations from students.
The teams were challenged by contest sponsors Qeexo, the maker of the machine learning platform AutoML, and Arduino, an open-source electronics hardware and software platform, to provide solutions for real world problems using embedded machine learning. Students’ projects include a device that monitors hand movements to allow it to be almost unbeatable in a game of rock, paper, scissors to a another device that helps fly fishermen perfect their cast.
Link to the full article: https://www.news-journal.com/news/local/letourneau-university-students-design-artificial-intelligence-projects-for-contest/article_c936dc60-2088-11eb-930c-bb89584d78c8.html

Qeexo AutoML enables machine learning application developers to do analysis of different performance metrics for their use-cases and equip them to make decisions regarding ML models like tweaking some training parameters, adding more data etc. based on those real-time test data metrics. In this article, we will discuss in detail regarding live classification analysis module.

Once the user clicks on Live Classification Analysis for a particular model, they will be directed to the Live Classification Analysis module that would resemble below screenshot.

In this module we won’t be discussing Sensitivity analysis. To refer to details regarding sensitivity analysis, please read this blog.

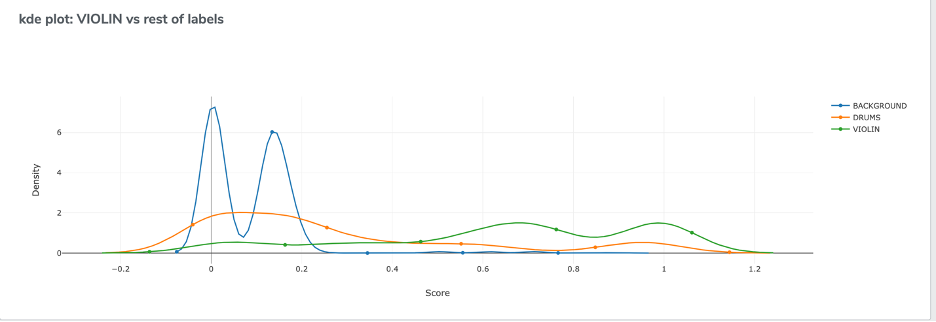
For the purpose of this blog, we will use a use-case which aims to classify a few musical air gestures: Drums, Violin and Background. These datasets can be found here.
Qeexo AutoML supports live data collection module which can be used to collect data to do analysis on. Data
collection requires a Data collection library to be pushed to the respective hardware. A user can push the library by clicking the “Push To Hardware” button shown below.

Once, they click the button and the library flashing is successful, the user will be able to record the data for trained classes in the model for analysis purpose. The user can select any number of seconds of data to do the analysis on. For this particular use-case, we have 3 Classes: Drums, Background and Violin as shown below.

Once the user clicks “Record”, they will be redirected to Data Collection page as shown below. This module is same as the Data Collection module which is used to collect training data.

As the user collects data for respective classes, they will be able to able to see the data in tabular format shown below. They can see the dataset information, delete data and re-record based on their preference.

Once, the user has collected the data, they can select whichever data they want to do analysis on by selecting the checkbox as shown above. Once, the user has selected atleast 1 dataset, they will see the Analyze button is activated and as we say, with Qeexo AutoML, “a click is all you need to do Machine Learning”, they will be able to analyze different performance metrics!

Qeexo AutoML supports 5 different types of performance metrics listed below:
For the use case of this blog, please find respective metrics below:


With these performance metrics, a user can determine how “well” the model is performing on test data or in live classification scenario. With the help of this module, a user can decide different aspects of a ML pipeline like whether to retrain a model with different parameters, whether more data will help improving the performance or different sensitivities for different classes should be considered. In a nutshell, Live Classification Analysis enables the user to take more control over ML model development cycle based on performance analysis on test data.